Do special servicers negotiate modifications differently?

February, 2014

The Facts about Retail Mortgage Delinquencies

February 10th, 2014 by ewcAdmin

The facts surrounding Retail Mortgage Delinquencies can be confusing. That’s because there are significant differences in the various types of retail properties

Overall Retail Statistics

1. In 2013 there is a year over year decline of approximately 50% in new distress situations.
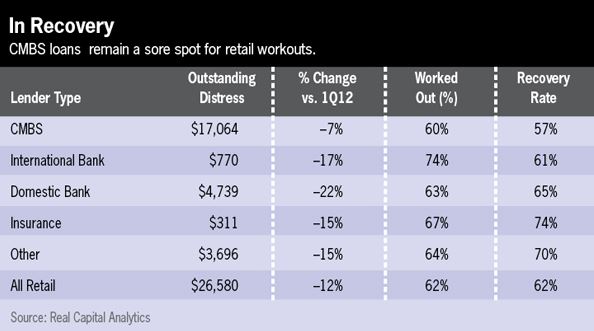
2. The total volume of distressed retail mortgages totaled $26.8Billion in Q1 2013.
3. CMBS loans account for the greatest share of distress in the retail sector at $17B
4. In second position are banks at $4.7B
5. Other lending entities total $3.7B
6. Last are international banks at $770MM
7. In the past 12 months, CMBS lenders had the smallest decline in the total volume of distressed loans of any lender type (7%), the lowest workout level of any lender type (60%), and the lowest recovery rate (57%).
8. Retail loans currently account for 24.8% of all CMBS loans in Special Servicing
9. While Delinquencies are Down; Losses are Up
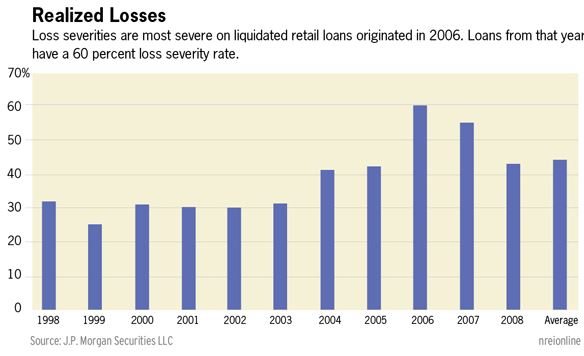
10. Loss Severity for CMBS retail loans are higher than loans for other properties – (50.26%)

Contributing Factors

1. National drop in the number of available retail tenants caused by e-commerce competition
2. Retailers are only opening stores in the most productive locations
3. Mid-tier and lower-tier properties are at greater risk of vacancy as owners report better operating metrics at class-A centers
4. When struggling centers lose clients, they are more difficult to replace
5. Class-C malls are experiencing very high loss severity
6. A key factor is that CMBS lenders have taken greater risks than portfolio lenders in issuing new mortgages in the boom years in both the quality of assets and the loan terms offered

Summary

The numbers speak not only to the retail sector, but to the inordinate amount of retail financing provided by CMBS. In addition, due to the increasing competition of e-commerce, many lower tier locations are more vulnerable to the loss of anchor tenants, and subsequent severe distress.

Excerpts of this article were taken from National Real Estate Investor, “Retail Mortgage Delinquencies Are Down, but Loss Severity for Troubled Loans Is Sky High”, by Elaine Misonzhnik, May 2, 2013

Retail Mortgage Delinquencies Are Down, But Loss Severity for Troubled Loans is Sky High

Retailer’s continued efforts to right-size their portfolios are leading to undesirable side effects for legacy retail mortgages. Research firms that focus on the credit markets report that even as the overall volume of distressed retail loans has been shrinking, loss severities have been growing.

At fault is the drop in the number of available retail tenants, says David Putro, vice president and team leader with the CMBS surveillance group at Morningstar Credit Ratings LLC. As retailers shrink their bricks-and-mortar portfolios and implement omni-channel strategies they are only opening new stores in the most productive locations, at the best retail centers. That means that mid-tier and lower-tier properties are at increased risk of vacancy and default, even as owners of class-A centers report better operating metrics. It also means that once a struggling center loses a tenant, it’s much more difficult to find a replacement, adds Joe McBride, a research analyst with New York City-based research provider Trepp LLC.

“It’s starting to become a dichotomy of good malls and bad malls, there is not a whole lot of middle ground at this point,” Putro says. “And those class-C malls that are losing anchors that are never [quite] restored are suffering very high loss severity when they liquidate.”

The big picture

In the first quarter of 2013, the volume of newly distressed retail mortgages rose slightly from year end 2012, to $1.2 billion, according to Real Capital Analytics (RCA), a New York City-based research firm. The good news is that the figure still represents a year-over-year decline of approximately 50 percent in new distress situations. The total volume of distressed retail mortgages totaled $26.8 billion in the first quarter. RCA reports that 62 percent of all retail distress situations reported during this market cycle have already been worked out.

CMBS loans currently account for the greatest share of distress in the retail sector, at $17.0 billion in loans outstanding. Distressed loans underwritten by domestic banks fill the number two spot, at $4.7 billion, followed by loans issued by entities described as “other,” at approximately $3.7 billion.

International banks had $770 million in retail loans outstanding in the first quarter, while insurance companies faced $311 million in distress situations. Both of the latter lender groups also reported the highest levels of loan workouts, at 74 percent and 67 percent respectively, and insurance companies boasted the best recovery rates, at 74 percent, according to RCA.

The trouble spot

Over the past 12 months, CMBS lenders experienced the smallest decline in total volume of distressed retail loans, at only 7 percent; the lowest workout level of any lender group, at 60 percent; and the lowest recovery rate, at 57 percent.

That’s because CMBS lenders have taken greater risks than portfolio lenders in issuing new mortgages during the boom years, in both the quality of assets they were willing to underwrite and their loan terms, according to McBride. The “pretend and extend” approach many servicers exercised over the past few years hasn’t helped matters.

Plus, retail properties, along with office buildings, have historically accounted for a disproportionately large share of all CMBS issuance. In 2004, for example, retail accounted for 35 percent of all CMBS originations, more than any other property type, reports J.P. Morgan Securities LLC. The loss severity for retail CMBS loans issued that year is 41 percent, according to J.P. Morgan estimates. The loss severity for retail CMBS loans issued at the very peak of the market, in 2006, is a whopping 60 percent. (The average loss severity for all CMBS loans issued that year is 43 percent).

Today, loans backed by retail assets account for 24.8 percent of all CMBS loans in special servicing, second only to loans backed by office buildings. In total, there are 1,054 retail loans in special servicing, with an aggregate balance of approximately $14.1 billion and average loan size of $13.4 million. Many of those loans are backed by properties in Georgia, Nevada and Southern California, J.P. Morgan reports.

Those numbers might still grow. Morningstar Credit Ratings reports that it added $858 million in retail loans, secured by 137 properties, to its CMBS watch list in March. Retail represented one-third of all CMBS loans added to the watch list that month, according to Frank Innaurato, managing director with the CMBS surveillance group at the firm. At the end of the first quarter, outstanding CMBS loans secured by retail assets accounted for $49 billion in aggregate, or more than 26 percent of all loans on Morningstar’s watch list.

“One of the things we are most worried about on the CMBS side, especially on regional malls with weaker anchors, is that as some of these loans approach maturities between 2014 and 2015 the ability to take out financing is going to be a challenge,” says Putro.

“Not everything is doom and gloom—the top-tier mall operators, who are better capitalized and have properties in better locations, are still reporting very good numbers. It’s just that when you get into the middle and bottom tiers there are issues out there. Those malls already have class-B and -C tenants in place and now some of those tenants might be in trouble.”

inrecovery

Delinquency down, losses up

In April, the delinquency rate on all CMBS loans backed by retail assets averaged 7.68 percent, an improvement over the peak of 8.3 percent reached in mid-2012 and also the lowest delinquency rate reported for any of the commercial property types, according to Trepp numbers. The retail delinquency also improved 23 basis points month-over-month. Loss severity for CMBS retail loans, however, is higher than for loans on other properties, at 50.26 percent, and it’s not likely to improve much in the coming months.

There are plenty of investors in the market eager to buy troubled retail loans, according to Gerry Mason, executive managing director with real estate services firm Savills LLC. But they are looking to buy these loans at 20 or 30 cents on the dollar, make minimal improvements to the underlying properties and then sell them in a relatively short period of time.

“At 50 percent loss severity is pretty high, so I don’t see it going much higher than that,” says McBride. “The hope is that it will come down, but after so much time and so many servicing fees and advances the CMBS servicers have had to deal with, even with the rebound in property values, they’ll still take pretty decent size losses.”

realizedlosses

REITs Ratchet up Office Purchases

February 10th, 2014 by ewcAdmin

The nation’s equity REITs are pivoting their investment strategies to increase their office property holding. Conversely, the REITs are selling more industrial properties to make room the office purchases.

REITs view Commercial Business District (CBD) properties as offering secure, stable cash flows. In addition, many REITs regard suburban office properties as “value add” opportunities. They will tend to hold on and re-tenant these office assets more than other institutional investors.

It’s all part of re-weighting their portfolio. Industrials are in a seller’s market. Offices represent secure cash flows that can be purchased on an all cash basis and leveraged for sale at a later date.

Risk plays a big part in this trend. When compared to the industrial and retail sectors, the office sector has the least risk to dramatically evolve over the next 20 years, Significant change is forecasted in the Industrial sector which is moving to a big-box, modern distribution age. Similarly, the Retail sector is continuing to evolve as competition becomes more intense with e-commerce. These forecasted changes create more uncertainty in long term investments.

In terms of office space, medical and tech space are in particularly high demand.

In 2012, REITs acquired twice as much property as they sold. This year the gap has been cut in half as this re-weighting process takes hold.

Excerpts taken from CoSrtar Advisor Newsletter, “REITs Turning to Office Properties for Future Growth” by Mark Heschmeyer, October 9, 2013.

Office Vacancies Forecast

February 10th, 2014 by ewcAdmin

The Slow Pace of the Office Sector Recovery

1. Office vacancies have remained elevated since they peaked in late 2010 at 17.6%. At the end of Q2 2013, vacancies are still 17%.
2. The pace of the office sector’s recovery has been very weak. Vacancies have not been below 17% since Q3 2009.
3. Q2 2013 showed an increase of occupied space of 7.2MM sq. ft. However, this was mostly construction-driven absorption as 7.6MM sq. ft. of new space became available.
4. For the most part, same-store absorption numbers indicate small demand for space in existing buildings.
5. Additionally, the 7.6MM sq. ft. of new space is not a trend. The last time 7MM sq. ft. of new space was added was in Q2 2010. Q1 2013 showed only 2.2MM sq.ft. of new space added.
6. Cumulative and asking rents grew 4.7& and 5.4% respectively in the last 11 quarters. Prior to the current recession, annual growth approximated those numbers

Which Markets are Performing Better

1. The top 6 metros ranked by effective rent growth in Q2 2013 were San Jose, San Francisco, New York, Seattle, Houston, and Dallas. In these markets, the recovery has been led by Tech and Energy firms.
2. New York and Washington DC were the tightest in terms of vacancy rates – both at 9.7%.

Forecast for Q3 and Q4 2013

1. Up until September, GDP growth indicated that the economy had performed better than recently thought, but employment figures had been flat.
2. Forecasters were cautious about the remainder of 2013 for the office sector.
3. The Government Shutdown and forthcoming budget discussions may result in even weaker projections for the office sector as office properties are not the primary recipients of new job growth.

Excerpts taken from National Real Estate Investor, “Office Vacancies Remain Elevated” September 10,2013; by Brad Doremus is senior analyst, and Victor Calanog is head of research and economics, for New York-based research firm Reis.

Office Vacancies Remain Elevated

With the labor market unable to generate significant office-using employment, demand for space remains muted. It is therefore unsurprising that national vacancies have not declined much since they peaked at 17.6 percent in late 2010. Vacancies refused to budge during the second quarter, remaining at 17.0 percent. This is a nominal slowdown from the prior quarter’s 10 basis point decline in vacancy.

The pace of the office sector’s recovery has been very weak: on a year-over-year basis, the vacancy rate fell by a scant 30 basis points. National vacancies remain elevated at 450 basis points above the sector’s cyclical low, recorded in the third quarter of 2007 before the recession began that December.

stubbornlyhigh

Occupied stock increased by 7.2 million sq. ft. in the second quarter, largely driven by 7.6 million sq. ft. of office space that came online. Without this construction-driven absorption, same-store absorption figures indicate that there is little to no demand for space in existing buildings. At this point in the recovery, rental rates are still compressed across new versus existing space; combined with aggressive concession packages tenants will tend to favor new buildings of comparable quality.

While comparatively modest by historical standards, having inventory increase by 7.6 million sq. ft. does support the notion of supply growth trending towards a more normal rate. The market has not delivered as much new space since the second quarter of 2010 when many projects were completed only because they had been started before anyone fully grasped the magnitude of the Great Recession. Auspiciously, this quarter’s increase in construction activity comes hot on the heels of last quarter’s 2.2 million sq. ft. of new office space, the lowest quarterly figure for new completions since Reis began publishing quarterly data in 1999.

Asking and effective rents both grew by 0.4 percent during the second quarter, the eleventh consecutive quarter with increases. This is about on par with the quarterly average growth rate since rents began rising consistently in the fourth quarter of 2010. Yet, the cumulative growth in asking and effective rents during this eleven-quarter recovery period is only 4.7 percent and 5.4 percent, respectively. For comparison’s sake, the office market is able to produce that kind of rent growth in typical calendar-year periods. Rents remain below peak levels set in 2008. Without stronger GDP growth and more robust figures for job creation, it will take years to return to those levels.

Tech and energy markets dominate

Effective rents managed small increases in 70 out of Reis’s top 82 markets; occupancy gains were mixed, with roughly half posting gains and others registering flat or declining performance. This quarter, the top six metros ranked by effective rent growth (San Jose, San Francisco, New York, Seattle, Houston, and Dallas) are all either tech- and energy-markets. Even in New York, long known as the financial capital of the world, the technology companies in “Silicon Alley” in Midtown have led the market’s recovery. This metro-level dynamic reflects the overall economy where the technology and energy sectors continue to be the clear outperformers.

New York has tied Washington, D.C. as the tightest market in terms of vacancy rates, coming in at 9.7 percent for the second quarter of 2013. Sequestration has had the most pronounced impact on the Washington, DC area. In fact, D.C.’s vacancy rate actually rose by 20 basis points this period after rising by the same amount in the first quarter. The surrounding suburban areas, which are also strongly tethered to the presence of federal government, showed vacancy increases as well. Suburban Virginia’s vacancy rate increased by 70 basis points during the quarter while Suburban Maryland’s vacancy rate increased by 30 basis points.

steadygains

Outlook for the balance of 2013

There is some optimism given the underlying resurgence in the economy that the labor market will perk up following some recent weakness. Second quarter GDP growth was revised up to 2.5 percent, indicating the economy has performed better than recently thought. Additionally, data on manufacturing as well as auto sales points to a more upbeat assessment of the U.S. economy. However, employment figures have still been lackluster. August payrolls came in below expectations while downward revisions were made to both June and July figures. In fact, July’s revised payroll increase was the lowest monthly figure since June of last year.

Given the mixed bag of economic news, we remain cautious about the remainder of 2013, especially for the office sector. The economy is certainly heading in the right direction, but office properties are not large beneficiaries of the economy’s recent bright spots; namely, the auto and housing sectors. Overall job growth for 2013 is only on pace to match 2012, and office using employment growth is still among the laggards. As such, we expect office vacancies to descend very slowly, ending the year at just below 17.0 percent, and asking and effective rent growth to be below 3 percent.

Brad Doremus is senior analyst, and Victor Calanog is head of research and economics, for New York-based research firm Reis.

Multifamily Sector Improvements Slowing Down

February 10th, 2014 by ewcAdmin

Apartment Sector fundamentals have improved steadily over the last 4 quarters. There are signs, however, that these improvements are decelerating. The question for investors is: what does this mean?

Over the last 4 quarters, national vacancies have declined by 70 basis points, a faster pace than any other sector in commercial real estate. Since the peak of the recession in late 2009 of 8% vacancy, vacancies have fallen by 3.7%. IN contrast, office sector vacancies have only fallen by 60 basis points since they began to recover 5 quarters ago.

Apartment Sector Improvements to date:

1. 3.7% decline in vacancies as noted above
2. Healthy absorption for last 5 quarters (36,000 units in 2013 Q1)
3. Modest Inventory Growth Throughout recovery period

Factors that may cause apartment demand to slow down:

1. Over 100,00 units are projected to enter the market in in the second half of 2013
2. Home prices are recovering and mortgage rates have remained relatively low
3. Asking and effective rents both grew by 0.5% in Q1 2013. This is the slowest pricing growth since Q4 2011.

Summary:
The next few quarters will test whether the Multifamily Sector can sustain continuing improvements in terms of vacancies, new absorption, and increasing rents. For landlords, these trends – which are available by sub market – will assist in forecasting operations and cash flow going forward.

Excerpts taken from National Real Estate Investor, April 16, 2013; written by Brad Doremus is Senior Analyst, and Victor Calanog is head of research and economics, for New York-based research firm Reis.

What Do Slowing Improvements in Fundamentals Mean for the Multifamily Sector?

According to preliminary first quarter 2013 resultsfrom Reis, apartment sector fundamentals continued to improve, with vacancies dipping into the low four percent range. Asking and effective rents continued to increase, but there are some signs that improvements in fundamentals are decelerating somewhat.

The national vacancy rate fell by 20 basis points in the first quarter, dipping to 4.3 percent. Over the last four quarters, national vacancies have declined by 70 basis points, a far faster pace than any other sector in commercial real estate. The vacancy rate has now fallen by 370 basis points since the cyclical peak of 8.0 percent, observed right after the recession winded down in late 2009. By contrast, office sector vacancies have only fallen by 60 basis points since fundamentals began recovering five quarters ago.

The sector absorbed over 36,000 units in the first quarter, a relatively healthy rate comparable to the rise in occupied stock from one year ago (in the first quarter of 2012). Deliveries have remained modest at 13,706 units, representing roughly the same pace of inventory growth as previous first quarter periods over the last two years.

Apartment landlords have another quarter or two to enjoy tight supply growth before a large number of new properties come online. Over 100,000 units are expected to enter the market, most scheduled to open their doors in the latter half of the year. With home prices recovering and mortgage rates staying low, it remains to be seen whether demand for apartments will continue to push vacancies down once inventory growth ramps up.

Asking and effective rents both grew by 0.5 percent during the first quarter. This is the slowest rate of growth for both asking and effective rents since the fourth quarter of 2011; every single quarterly data point in 2012 showed stronger asking and effective rent growth versus what was observed in the current quarter. What does this mean?

hittingthebrakes

Optimists will point out that the first quarter tends to be weak, as most households move during the second and third quarters and bolster leasing activity and rent increases. The seasonal waxing and waning in rent growth was evident in the prior year, when the strongest periods centered around the second and third quarters.

However, given how tight vacancies have become, rent growth ought to be stronger (for perspective, in prior periods when vacancies were in the low to mid 4-percent range, annual rent growth was well above 4 percent). Analysts have wondered how rents could keep climbing when jobs are being created at a sluggish rate and wage growth has been relatively stagnant: all of Reis’s major markets now boast rent levels well beyond peaks achieved prior to the recession. One answer is that the moribund housing market left households with little choice but to absorb rent hikes, but with the housing market now recovering, does that mean the tide is turning against landlords?

The next few quarters will test the robustness of apartment fundamentals in the face of rising supply growth and rent levels that may have climbed to unsustainable levels.

New York remained the tightest market in the country, boasting a 1.9 percent vacancy rate (vacancies declined by 20 basis points this quarter). New York is followed by eight other markets with vacancies under 3 percent; for many markets around the country, vacancies are at lows unseen in at least a decade. 67 out of 79 markets registered improvements in occupancy for the quarter.

On a year over year basis, every single metro out of Reis’s 79 top markets posted increases in asking and effective rents. However, quarterly numbers reveal some potential weak points. First, Washington, D.C. registered a small but negative trend for effective rents, declining by 0.1 percent. This is the first time Reis has recorded a decline in effective rents in Washington in four years; not since the first quarter of 2009 did effective rents fall in Washington—and even then, during the worst recession in recent history, effective rents only fell for one quarter before resuming its steady march upwards.

While a single quarter’s results do not necessarily imply a dismal trend, sequestration discussions are expected to impact MSAs like Washington disproportionately. The nation’s capital is also plagued by the prospect of a large number of new projects coming online this year and next, with over 3,000 units expected to open their doors in 2013 alone—the largest increase in supply growth on record in over 30 years of Reis history for the metro. Over the next 12 to 24 months what happens to Washington will be indicative of how evolving rates of demand for apartment rentals and supply of new projects determine the trajectory of fundamental variables like rents and occupancies.

Brad Doremus is Senior Analyst, and Victor Calanog is head of research and economics, for New York-based research firm Reis.

Why have Higher Interest Rates Not Affected Cap Rates to Date?

February 10th, 2014 by ewcAdmin

The Facts:

1. Investment sales volume has held up in the months since the rise in interest rates earlier this year.
2. Despite the recent interest rate increase (approximately 1%), investors continue to buy properties in the same places they focused on before the rise, and at about the same prices.
3. A number of markets throughout the US are experiencing record pricing. New York City, and San Francisco are two such areas where office pricing has risen. In addition, pricing for most other asset types are also rising.
4. Current overall cap rates continue to be low: Apartments – 6.1%; Office – 6.8%; and Retail — 7.0%.

An Explanation:

Walter Page, Director of US Research for CoStar explains that “investors were expecting that income rate rise”.

In addition to investor expectations of an interest increase, Page points out that the spreads between cap rates of commercial real estate properties and 10-year Treasuries was larger than normal prior to the interest increase. After the increase, lenders did not continue to chare the same spread as had been the case prior. As a result, investors have not yet experienced the full effect of the rising interest rates.

Mr. Page points out that another percentage point added to the yield to 10-year Treasuries and other investments that compete with commercial real estate could result in cap rate increases.

Good news for now; but not necessarily an indicator for the future.

Excerpts taken from National Real Estate Investor, (NREI), “Higher Interest Rates Do Nothing for Cap Rates – For Now”, September 18, 2013

Higher Interest Rates Do Nothing to Cap Rates – For Now

he numbers are coming in—investors are largely ignoring the big jump in interest rates that took place earlier this year. They continue to buy properties in roughly the same places they focused on before interest rates rose at about the same prices relative to the income from the properties.

The latest data from CoStar show that investment sales volume has held up in the months since rates have risen.

“Investors were expecting that interest rate rise,” says Walter Page, director of U.S. research for office for CoStar Inc. “A 1 percent rise to interest rates was fully baked into the numbers.”

However, a further rise in interest rates could have a noticeable effect, says Page. Specifically, another percentage point added to the yield on 10-year Treasuries and other investments that compete for investor attention with commercial real estate could add half a percentage point to cap rates.

For now, prices have continued to rise for top properties in core markets.

“We’ve seen some record pricing on stuff across the country,” says Page. For example, the CoStar’s numbers show that for the top 20 percent of sales for office buildings in New York City the median price continues to climb past $1,200 per square foot. That’s 12 percent greater than the previous peak of 2007 for the New York City office market. “There’s a similar story in San Francisco,” Page says.

Investors continue to bid prices higher for prime properties in the most expensive, core markets. The volume of investment sales is also relatively unchanged, according to preliminary numbers from CoStar. A total of $20.4 billion in office properties changed hands in the second quarter in the U.S., up slightly from both $18.4 billion in the first quarter and from $19.3 billion in the second quarter of 2012. The high volume of transactions has continued in the third quarter, Page says.

Prices continue to be strong for most property types—with the possible exception of garden apartments, whose prices have slipped slightly relative to income. “The only real place we are seeing cap rates tick higher is with garden apartments—up about 20 to 30 basis points nationwide,” says Dan Fasulo, managing director for Real Capital Analytics (RCA). Average cap rates for garden apartments are now around 6.5 percent—up from 6.2 percent at the beginning of the year, with the bulk of that uptick taking place in the Spring.

Cap rates for other property types continue to be low, according to RCA, with apartment overall at 6.1 percent. Average cap rates for office properties have fallen to about 6.8 percent from 7.1 percent earlier this year. Average cap rates for retail spaces are at 7.0 percent, down from 7.1 percent.

Interest rates rose sharply earlier this summer after officials at the U.S. Federal Reserve said they might begin “tapering” off their quantitative easing program later this year. The markets immediately responded. The yield on 10-year Treasuries rose steadily from below 1.8 percent in May to over 2.9 percent today.

Investors had been expecting interest rates to rise, according to Page. He could see that earlier this year in the difference between the capitalization rates on sales of commercial real estate properties and the yield on 10-year Treasury bonds. “The spreads were abnormally large,” says Page. The increase in Treasury bond yields has put the difference between cap rates and Treasury bond yields into a more normal range.

Also, an extra percentage point in yields for Treasury bonds has not turned into a full extra percentage point in interest charged to commercial and multifamily real estate properties. In part that’s because most lenders never offered interest rates as low as one might expect, given the low yield on Treasuries. Instead the spread charged by lenders widened as lenders kept the extra for themselves. “Banks didn’t follow the Treasury rates all the way down,” says Fasulo.

So when Treasury yields rose again, banks didn’t have to add that rise directly to their interest rates. Once again, another increase in Treasury yields would probably have a much more clear effect in the interest rates charged to commercial and multifamily properties… and to real estate prices.